Chapter 5 Construction and Content
5.1 Input Spreadsheet
NOTE: This section describes input spreadsheet hosted on Google Drive.
Self-hosted runs use target_list.tsv located in data directory.
Each entry obtained from the search results in the interactive online
platform of EZCancerTarget is referenced and has at least one scientific
piece of evidence. Figure 5.1 shows a flowchart on
the processing steps and workflow of EZCancerTarget.
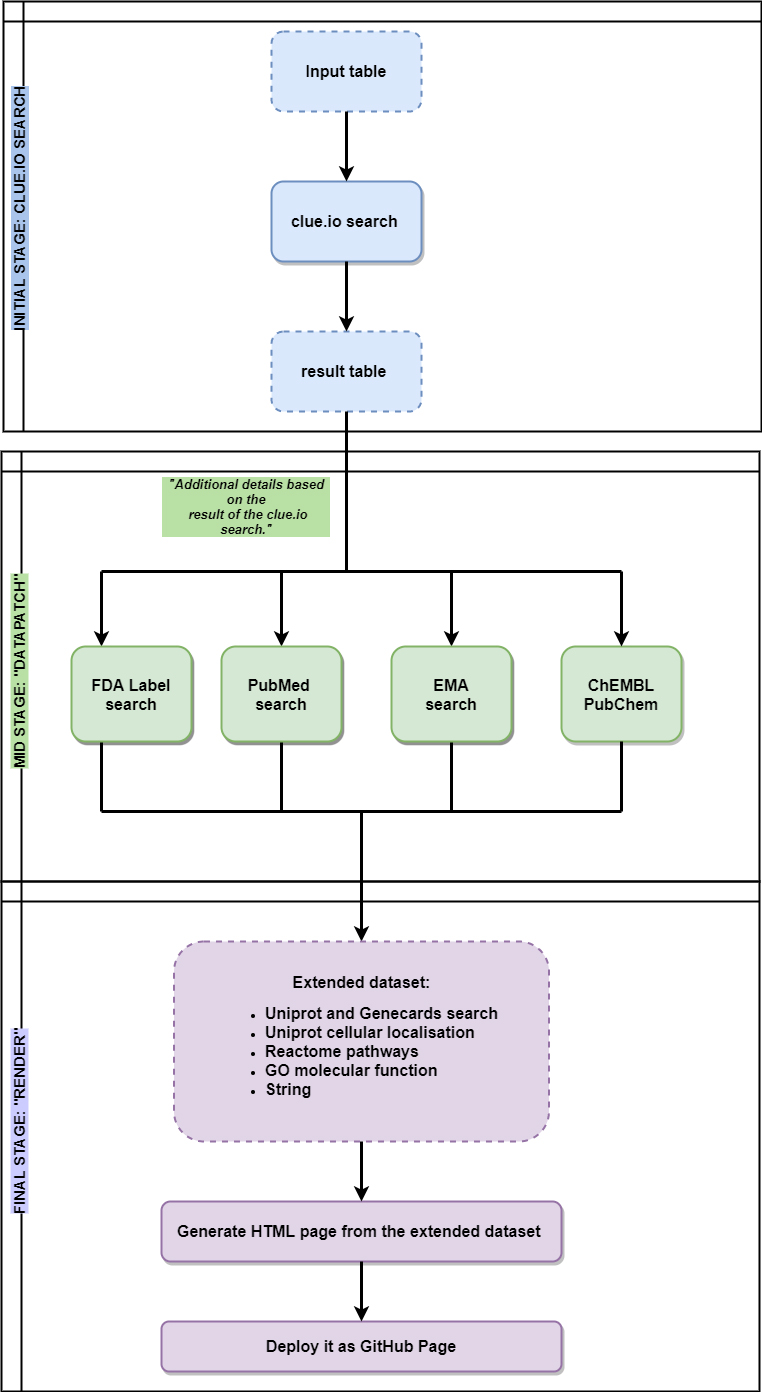
Figure 5.1: Flowchart of functionality describes the main steps of EZCancerTarget’s functionality, including data input, clue.io target search, cross-referencing in databases (Datapatch) and molecular background information on selected targets (Render).
First, users of
EZCancerTarget can start their workflow by opening the project’s starting page on
GitHub (https://cycle20.github.io/EZCancerTarget/). Then, users can upload their target
list with three pieces of information into a Google Spreadsheet
(Target INPUT).
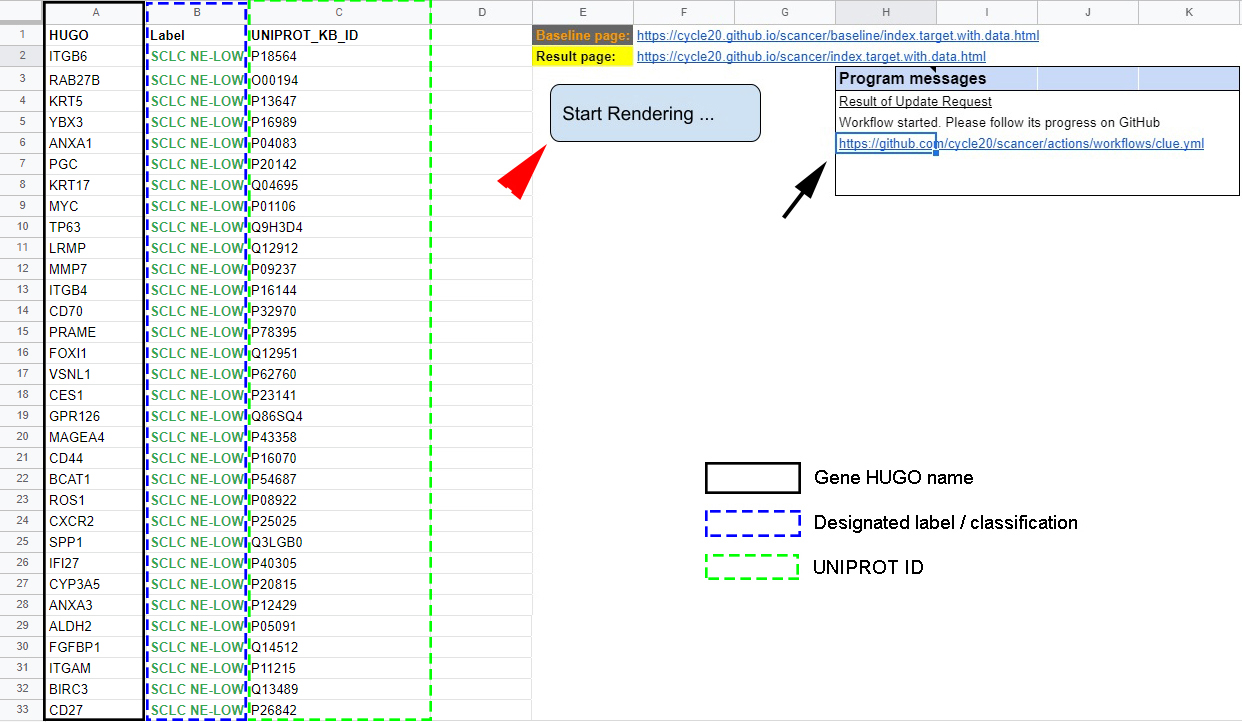
Figure 5.2: Input table of targets - Users can enter selected targets’ HUGO name (black rectangle), label (blue dashed rectangle) and UniProt ID (green dashed rectangle) in columns A, B and C. Hitting “Start Rendering” will initiate the clue.io search (red arrowhead). Progress can be traced by clicking on hyperlink in cells H6-K6 (black arrow). Clicking on the hyperlink in cell F2-I2 reveals the results page.
The first piece (Fig. 5.2 Column A), asks for the HUGO ID.
In Column B, users can give a “Label” for every target for classification and
clustering useful in later work.
The third piece (Fig. 5.2 column C) is the UniProtKB ID of
the searched gene. Inputs for the HUGO and Label columns are limited to
12 characters. On the right side of the spreadsheet (columns E-K), hyperlinks
provide access to the results page on GitHub, and
in the “Results of Update Request” box, users can check the query’s status.
Hitting the “Start Rendering” button located on columns E-F starts the query.
The area within E1-K8 are protected and automatically overwritten if edited
(Fig. 5.2).
5.2 Result Page
NOTE: This section describes result page made public on GitHub or
located in OUTPUT directory of EZCancerTarget in case of self-hosted run
index.target.with.data.html.
By clicking on the “Result page” link on the target spreadsheet, we can access
the results of our query within approximately 10 minutes. Clicking on
the hyperlink in cell H6 we can follow the progress of the query
(Fig. 5.2, arrow). A new query overwrites the earlier one in
the web application, but every previous version is saved on GitHub under the
“Result of Update Request” link
(https://github.com/cycle20/EZCancerTarget/actions/workflows/clue.yml).
A scrollable panel displays all the targets on the left with at least one valid
drug compound available. The software automatically excludes entries where no
drug or small molecule inhibitor/agonist is available according to the clue.io
repurposing hub.
In the first entry of the results list (“Summary”) the evaluation report on the search is accessible. In the “Overview” section, it displays the total number of found compounds for all listed targets and the average number of compounds per target. The amount of found compounds are classified according to their pre- and clinical phase as well. In the “Molecular Background” section details from the retrieved molecular background data is evaluated according to the number of found Reactome or KEGG pathways - Gillespie et al. (2021), Kanehisa (2002)] -, STRING interactors and GO molecular functions, subcellular localizations, biological processes. Finally (“Compound” section), every listed target is separately detailed of their compound entries in PubMed, PubChem, ChEMBL and DrugBank.
The platform creates a table for every target, where different columns indicate the mechanism of action (MoA), clinical status (preclinical, phase 1, phase 2, phase 3, or launched), and the search resources from PubMed, EMA and the direct entry from clue.io. Furthermore, the query table includes hyperlinks with DrugBank, PubChem, and ChEMBL IDs to quickly access the compounds’ chemical and pharmacological properties (Fig. 5.3).
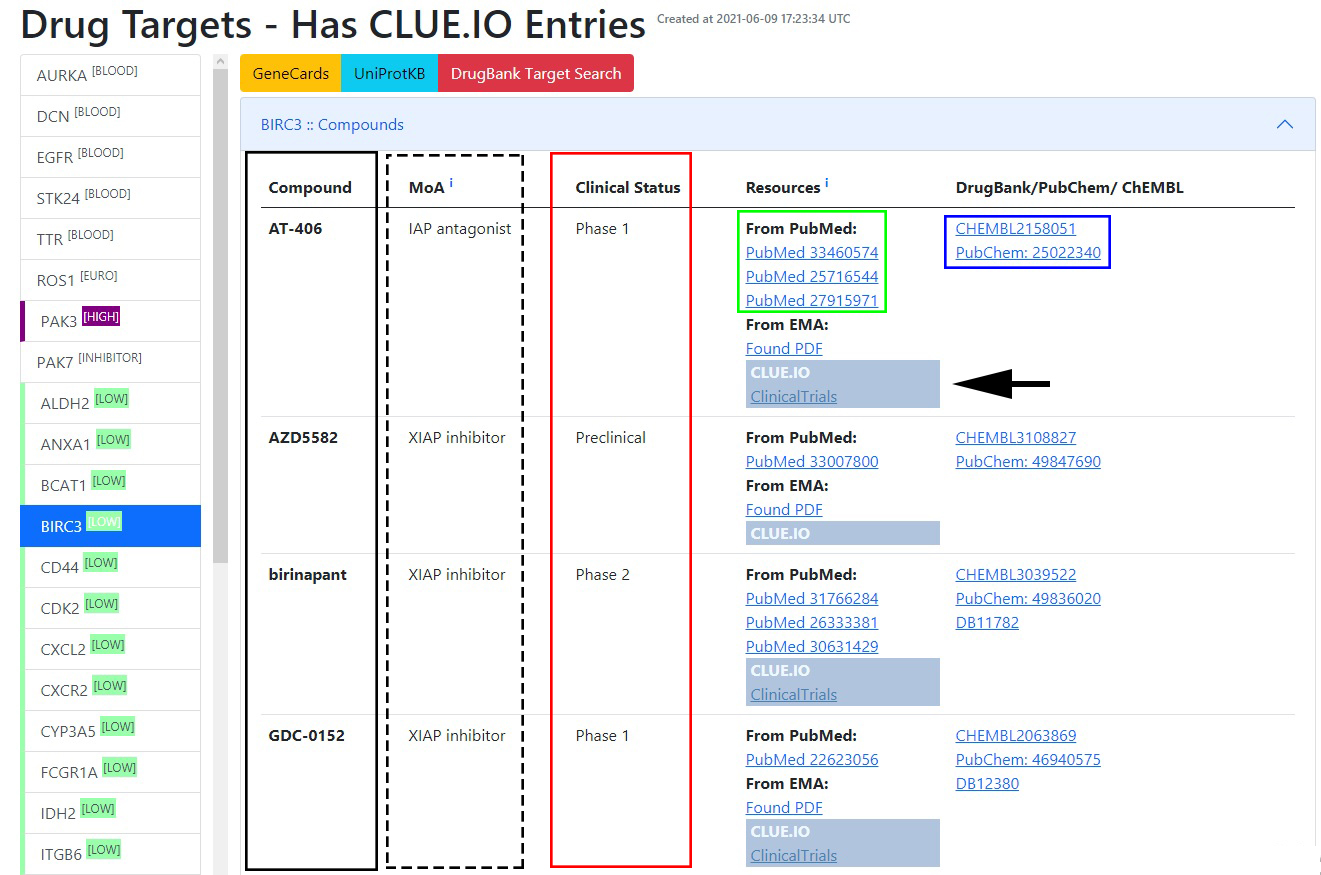
Figure 5.3: Targets and drugs - Clicking on the labels of selected targets (column on left side) unveils available compound list (black box) describing also mechanism of action (MoA, dashed box), clinical status (red box), resources of information on PubMed (green box) and DrugBank/PubChem/ChEMBL entries (blue box).
EZCancerTarget also gives a comprehensive, highly structured overview of the
selected targets regarding their molecular biology data,
including molecular function (Gene Ontology), their connectome (STRING),
participation in pathways, and cellular localization (Reactome and KEGG)
retrieved from various databases. Hyperlinks to GeneCards and
DrugBank Target Search are also available but differently structured as for
UniProt entries. The “STRING” entry opens a static STRING map for
the target and provides a hyperlink to https://string-db.org/ (Fig. 5.4).
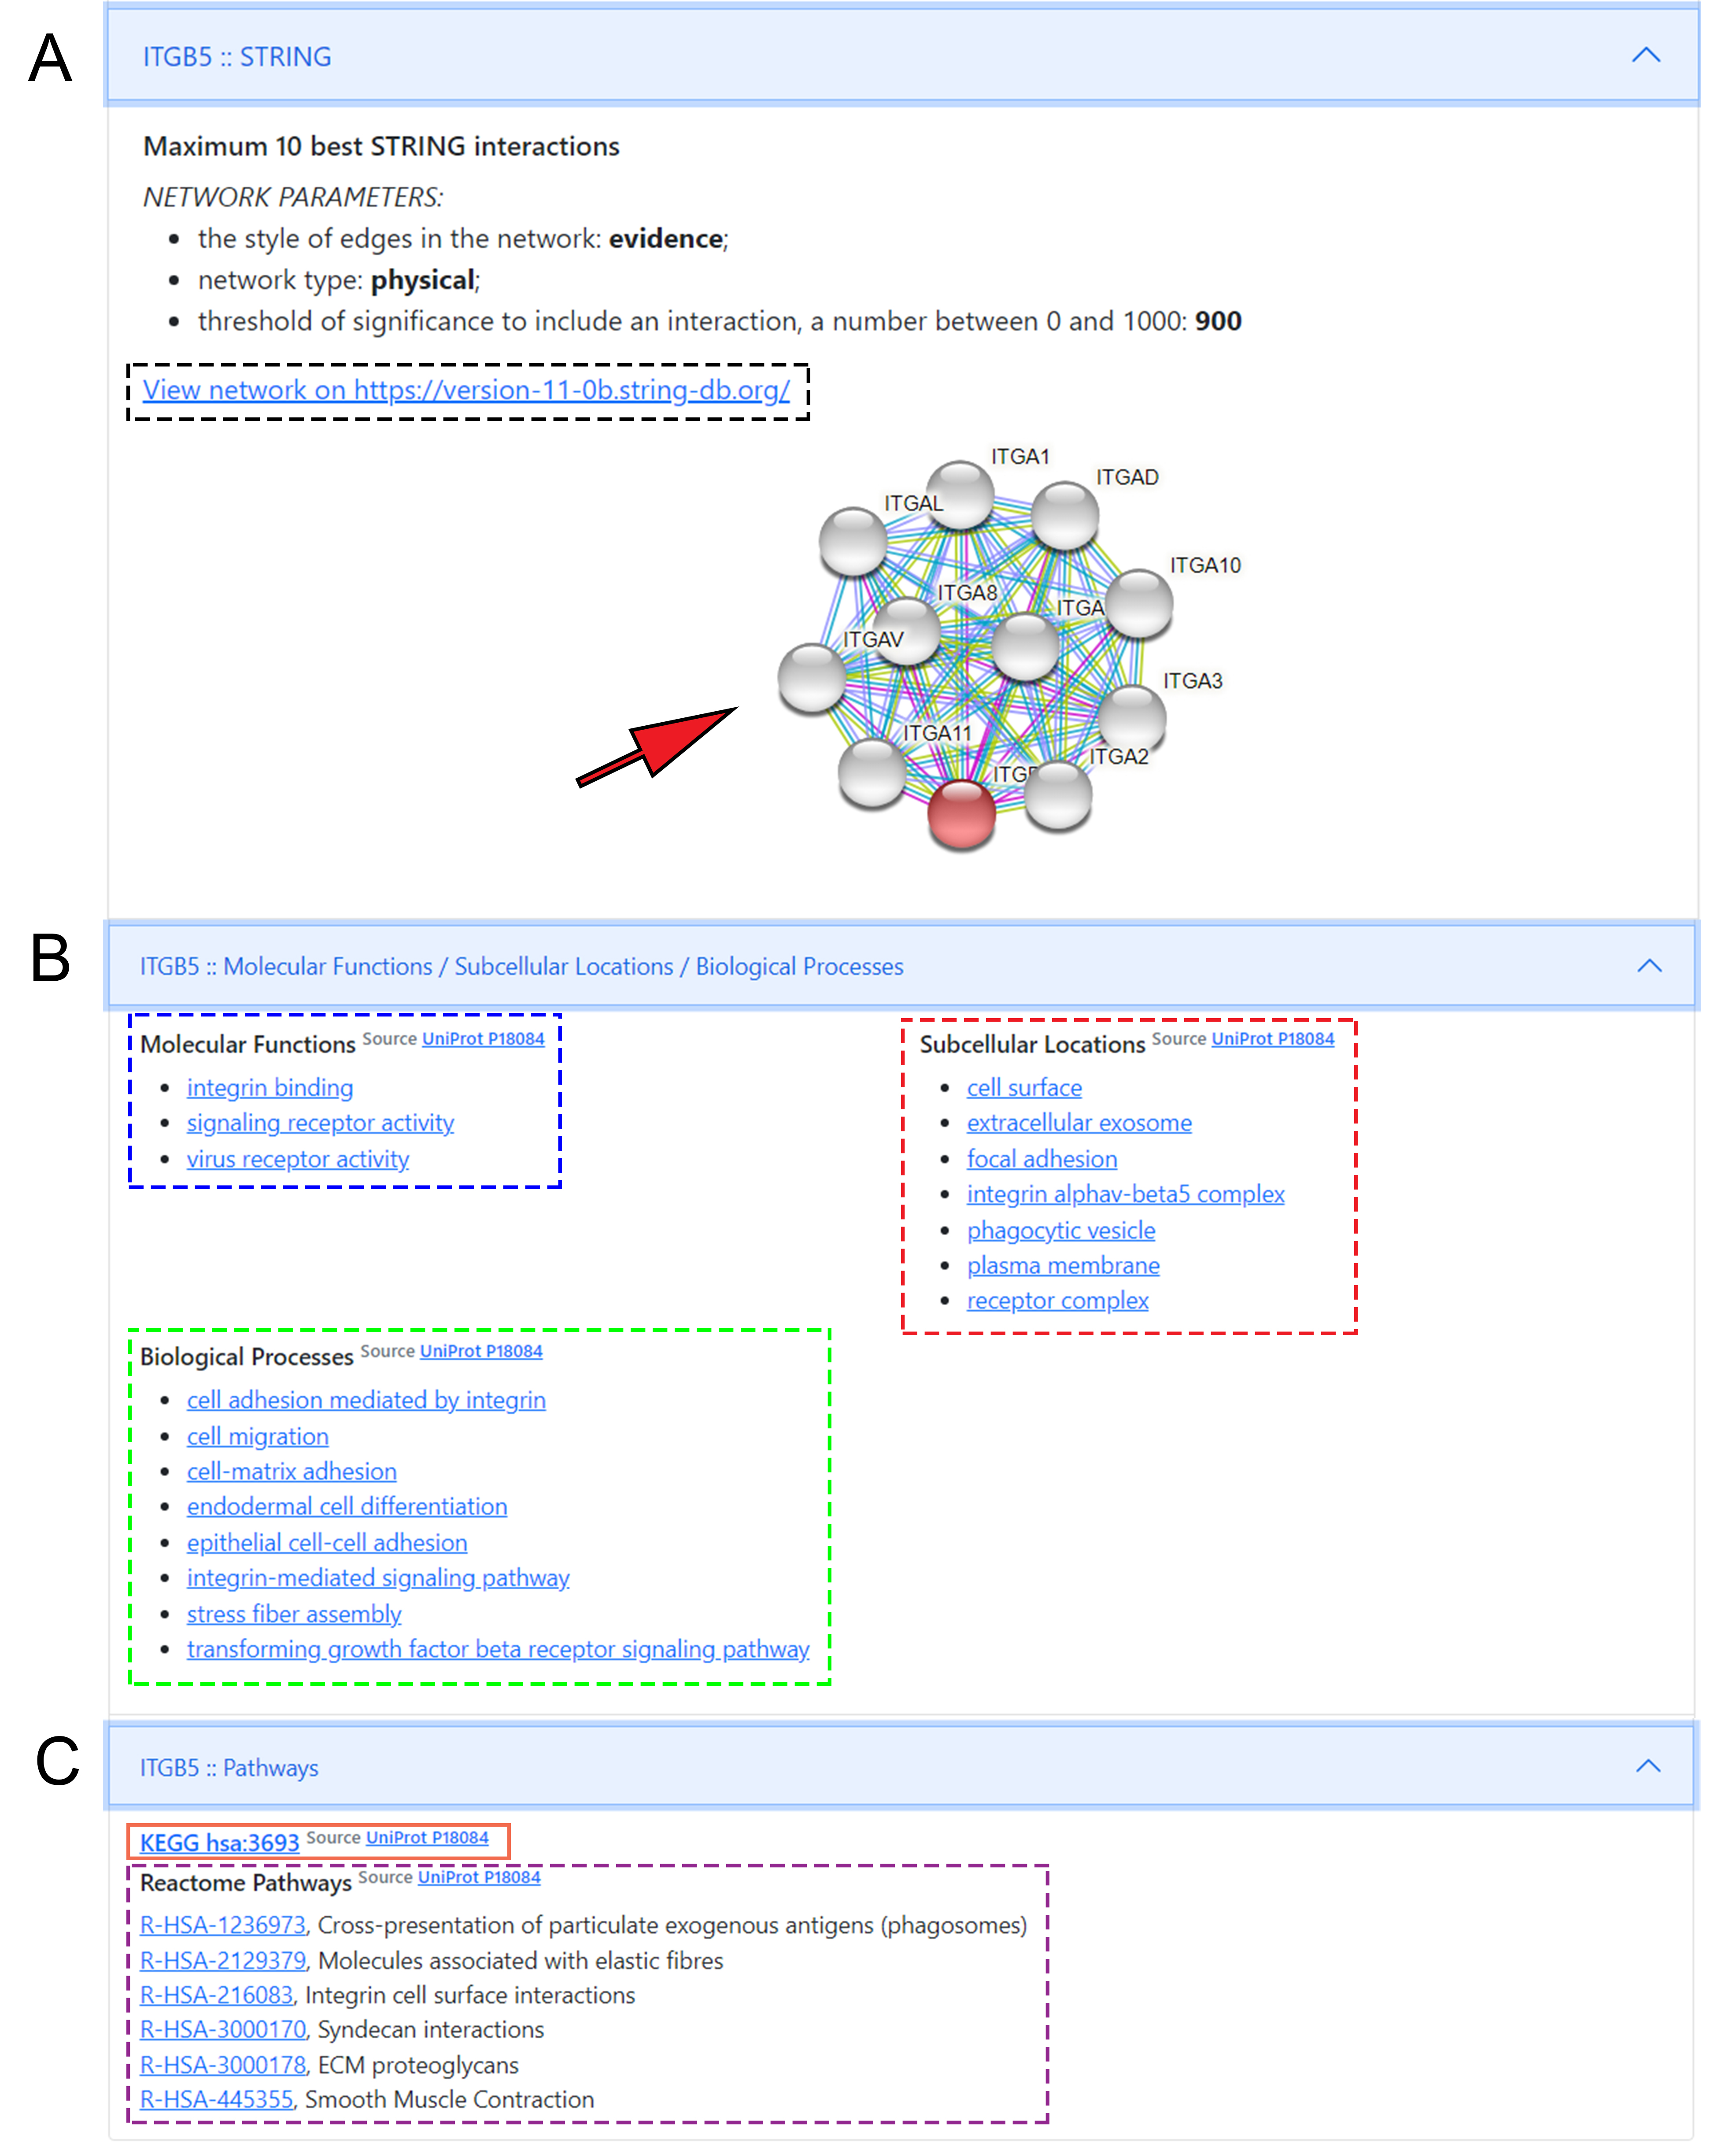
Figure 5.4: Molecular background of druggable targets - Details on the molecular background of druggable targets: Panel A shows the network map from STRING with static string map and hyperlink to STRING DB entry. Panel B displays hyperlinks to “molecular function”, “biological processes” and “subcellular localisation” to browse the UniProt database on molecular background. By clicking directly on the titles, we can access a specific function. Panel C shows hyperlinks to visualize KEGG and Reactome pathways of the selected target. For Reactome, clicking on individual pathway titles we can directly access the infographic of the given pathway.
The following entry carries the “Molecular Functions / Subcellular Localizations” title, where the two main hyperlinks (source) lead to UniProt’s “Function” and “Subcellular Localization” pages. Molecular function entries and target localizations are also provided as text separately, where hyperlinks lead to the QuickGO platform to obtain further information about relevant compartment-specific molecular pathways (Fig. 5.4). The last entry named “Pathways” provides links to every Reactome database, where the target’s participation is visualized in every relevant metabolic pathway (Fig. 5.4). The hyperlink to the entry of the KEGG database is also displayed here, without being broken down to individual links to pathways. Supplementary Video 1 shows a short tutorial about the functionality of the program and the main steps to generate a query.
References
Gillespie, Marc, Bijay Jassal, Ralf Stephan, Marija Milacic, Karen Rothfels, Andrea Senff-Ribeiro, Johannes Griss, et al. 2021. “The reactome pathway knowledgebase 2022.” Nucleic Acids Research 50 (D1): D687–D692. https://doi.org/10.1093/nar/gkab1028.
Kanehisa, M. 2002. “The KEGG Databases at GenomeNet.” Nucleic Acids Research 30 (1): 42–46. https://doi.org/10.1093/nar/30.1.42.